
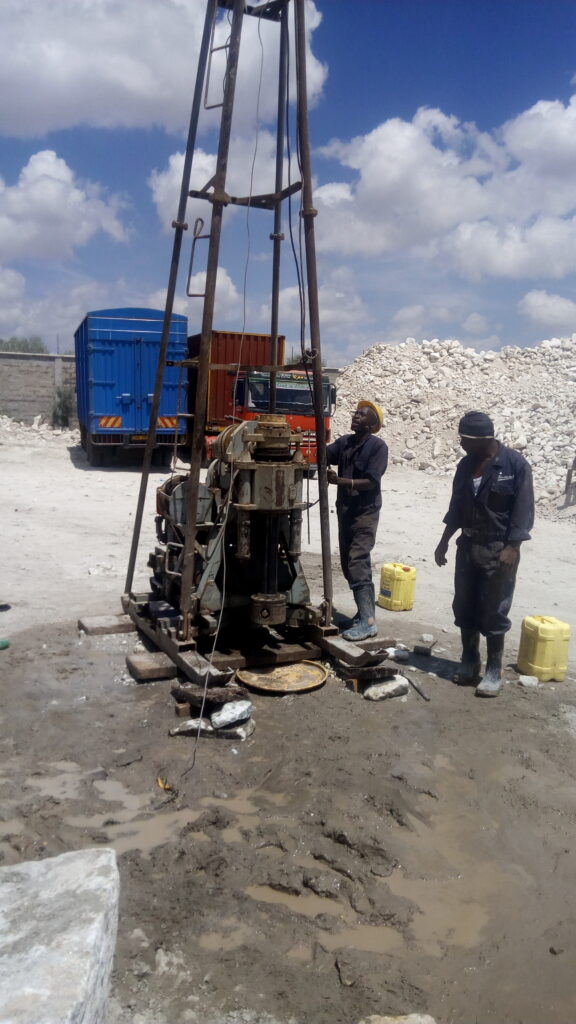
If you have ever read a borehole log, you have seen a column of small numbers labelled “N” or “SPT”. Those numbers come from the standard penetration test, one of the oldest, simplest and most widely used in-situ tests in geotechnical engineering. A hammer, a rod and a split tube are all it takes to estimate how dense or stiff the ground is at every depth in a borehole.
This guide explains how the SPT is performed, how to read the results, how engineers use them, and the limitations that every user should understand.
What Is the Standard Penetration Test?
The SPT is a dynamic field test carried out inside a borehole. A standard split-barrel sampler is driven into the soil at the bottom of the hole by repeated blows of a standard weight dropping a standard height. The number of blows needed to drive the sampler a set distance is recorded and used as an index of soil density or consistency.
The test has two purposes at once:
- It gives an in-situ measure of resistance, the N-value, which engineers correlate with soil properties.
- It recovers a disturbed soil sample from the split barrel, which can be inspected and sent for classification tests.
The test is standardised internationally by ASTM D1586, ISO 22476-3 and similar national standards, and it is common in Kenya and across East Africa, usually performed with cable percussion or rotary drilling rigs.
Equipment Used
A standard SPT setup includes:
- Split-barrel sampler (split spoon): a steel tube, typically 50 mm outside diameter and 35 mm inside diameter, about 600 mm long, that splits lengthwise for sample removal. A driving shoe at the tip cuts into the soil.
- Drive hammer: a 63.5 kg (140 lb) weight dropped through a free fall of 760 mm (30 inches) onto an anvil.
- Drill rods: connect the sampler to the surface and transmit the hammer energy.
- Hammer release system: this may be a manual rope-and-cathead system, a trip hammer or an automatic hammer. The release mechanism strongly affects delivered energy.
- Borehole and casing: the borehole must be clean and stable. Casing or drilling fluid prevents collapse, and the bottom must be cleaned of loose material before testing.
For coarse gravel and weak rock, a solid 60-degree cone can replace the split barrel. This variant is sometimes called the SPT-C or cone SPT and gives different results that need separate interpretation.
How the Test Is Performed
- Advance and clean the borehole to the test depth. The base must be free of cuttings and disturbed soil, and the groundwater level inside the hole should be kept at or slightly above the outside level to avoid blow-in of soil from the bottom.
- Lower the sampler on the drill rods to the bottom of the hole.
- Seat the sampler. The hammer drives the sampler through the first 150 mm (6 inches). This seating drive passes through any disturbed material at the base of the hole. The blows are counted but not included in the N-value.
- Drive the test interval. The sampler is driven through the next two 150 mm increments, a total of 300 mm (12 inches). The blows for each 150 mm increment are counted.
- Record the N-value. The N-value is the total number of blows needed for the second and third 150 mm increments, that is, the last 300 mm of penetration.
- Handle refusal. If 50 blows are reached before completing a 150 mm increment, or if 100 blows are reached in total, the test is stopped and called refusal. The penetration achieved is recorded, for example “50 blows for 80 mm.”
- Retrieve the sampler, open it and describe, photograph and store the sample in a labelled container.
Tests are usually performed at intervals of 1.0 to 1.5 metres, or at every change of stratum, as specified by the project.
For example, if the first 150 mm takes 4 blows, the second takes 8 and the third takes 10, the N-value is 8 + 10 = 18, written as N = 18 (with the seating blows reported as 4).
Understanding and Reading the N-Value
The N-value is expressed as blows per 300 mm. Higher numbers mean denser or stiffer soil.
Typical descriptive ranges for sands and gravels (cohesionless soils):
- N 0 to 4: very loose
- N 4 to 10: loose
- N 10 to 30: medium dense
- N 30 to 50: dense
- N above 50: very dense
Typical descriptive ranges for clays and silts (cohesive soils):
- N below 2: very soft
- N 2 to 4: soft
- N 4 to 8: medium stiff
- N 8 to 15: stiff
- N 15 to 30: very stiff
- N above 30: hard
These ranges are approximate guides, and different references give slightly different boundaries. Engineers use them for preliminary assessment, not as precise design values.
A typical borehole log lists N-values at each test depth alongside soil descriptions, and plotting N against depth reveals the strength profile of the site.
Corrections to the N-Value
Raw N-values (often called N-field or N-measured) are affected by testing conditions, so corrections are applied before using correlations. A commonly used expression is:
N₆₀ = N × (ER / 60) × CB × CS × CR
and, for sands, (N₁)₆₀ = N₆₀ × CN
Where:
- Energy ratio (ER): The percentage of theoretical hammer energy delivered to the rods varies with the hammer type and operator. Automatic hammers often deliver around 70 to 90 percent, while older rope-and-cathead systems can deliver around 45 to 60 percent. Values are normalised to 60 percent, giving N₆₀.
- Borehole diameter correction (CB): larger boreholes reduce resistance, so a correction is applied outside the standard range of about 65 to 115 mm.
- Sampler correction (CS): applies if the sampler is used without a liner when designed for one.
- Rod length correction (CR): short rods are less efficient at transmitting energy, so N-values at shallow depth are adjusted.
- Overburden correction (CN): In sands, resistance increases with depth because of confining pressure. The normalised value (N₁)₆₀ adjusts to a standard overburden pressure of about 100 kPa, allowing comparison between depths.
Consulting engineers specify which corrections to apply, and reports should state clearly whether the values shown are raw or corrected. Mixing raw and corrected values is a frequent source of design error.
What Engineers Use SPT Results For
Estimating density and strength. Empirical correlations link N to relative density and friction angle in sands, and to undrained shear strength in clays. A common rough correlation for clays is undrained shear strength Cu ≈ 5 to 6 × N kPa, though it varies significantly with soil type and should be used cautiously.
Estimating bearing capacity of shallow foundations. Established methods relate allowable bearing pressure to N-values and footing width. These are widely used for preliminary design, particularly for granular soils.
Estimating settlement. Some methods estimate settlement of footings on sand from N-values, although these carry large uncertainty.
Pile design. N-values are used to estimate shaft resistance and end bearing in driven and bored piles using empirical methods.
Liquefaction assessment. In earthquake-prone areas, the corrected (N₁)₆₀ value is compared with a cyclic resistance curve to evaluate liquefaction susceptibility of saturated sands. This is relevant in parts of the Rift Valley and lake basins.
Identifying layers and variability. Even without correlations, the N profile shows where strong and weak layers are, which helps locate the founding stratum and detect soft zones.
Estimating stiffness. Correlations between N and soil modulus are used in settlement and soil-structure interaction analyses.
Rock and weathered rock assessment. In weathered rock, high N values or refusal indicate competent material, though rock coring is needed for proper characterisation.
Advantages of the SPT
- Simple and robust: the equipment is rugged and widely available.
- Provides a sample: the split spoon recovers material for visual classification and laboratory index tests.
- Large database of experience: decades of correlations and design methods exist, which engineers know well.
- Works in many soil types: sands, silts, clays, gravels and weak rock.
- Cost-effective: it can be carried out in nearly any drilling operation without specialised equipment.
- Familiar to clients and regulators, making specification and review straightforward.
Limitations and Sources of Error
Understanding the limitations is as important as knowing the method.
- Variability in energy delivery. Different hammers, release mechanisms and operators give different energy, which is the largest source of scatter. Without calibration and energy measurement, results are uncertain.
- Operator and procedure effects. Poor borehole cleaning, wrong drop height, bent rods or inconsistent blow counting can change results considerably.
- Disturbed base. Loose material at the bottom of the hole gives artificially low N. In sands below the water table, inadequate water head in the borehole can cause blow-in and unreliable readings.
- Gravel and cobble effects. Large particles can obstruct the sampler and give artificially high N-values.
- Not continuous. The test gives data only at discrete depths, usually 1.0 to 1.5 metres apart, and may miss thin weak layers.
- Poor repeatability. Repeated tests at the same depth can give noticeably different results.
- Limited use in soft clays and very loose soils. Resistance may be very low, giving poor resolution. Other tests, such as CPT or vane shear, perform better.
- Empirical correlations carry scatter. Strength and stiffness derived from N are estimates, with substantial uncertainty.
- Disturbed samples. The sample is not suitable for strength or consolidation testing, so undisturbed sampling is needed for cohesive soils where those parameters matter.
- Rod and borehole effects. Long, flexible rods lose energy, and borehole instability affects results.
Because of these factors, SPT results should be used with judgement, supported by other data and tests where design is sensitive.
Best Practice for Reliable SPT Results
- Follow a recognised standard such as ASTM D1586 or ISO 22476-3 and state which one is used.
- Use calibrated equipment, and ideally measure or document hammer energy.
- Use trained crews with supervision by a geotechnical engineer or experienced technician.
- Clean the borehole thoroughly before each test, and maintain a positive water head in saturated granular soils.
- Use proper casing or drilling fluid to keep the hole stable.
- Record blow counts carefully for every 75 mm or 150 mm increment, and note refusal conditions.
- Describe samples properly and store them correctly.
- Report both raw and corrected N-values, with the correction factors used.
- Combine with other data, such as laboratory tests, CPT and geophysics, to validate interpretations.
- Interpret within the geological context. Local experience in Kenyan soils, such as black cotton soils and weathered volcanics, helps avoid misreading results.
A Short Worked Example
A borehole log shows these N-values in a sandy layer below the groundwater table:
- At 3.0 m: N = 12
- At 4.5 m: N = 18
- At 6.0 m: N = 26
Using the descriptive ranges, the sand is medium dense, increasing in density with depth. If the rig used a rope-and-cathead hammer with an estimated energy ratio of 50 percent, the energy correction would be 50 ÷ 60 ≈ 0.83, so the N₆₀ values would be lower than the raw values: about 10, 15 and 22. Overburden correction would then adjust them for depth. A designer using raw values without correction would overestimate the strength of the sand, which is why corrections matter.
Conclusion
The standard penetration test remains a workhorse of site investigation because it is simple, inexpensive and backed by decades of experience. It delivers both a resistance measurement and a soil sample, and it supports practical design methods for foundations, piles and liquefaction assessment. Its weakness is variability, so quality of equipment, procedure and interpretation matters greatly. Insist on standard procedures, calibrated energy, proper reporting of raw and corrected values, and good engineering judgement. Used that way, the SPT remains one of the most useful tools for understanding the ground.
